Histograms
In the Histograms menu, a proficiency test is performed in which a direct assessment of the own performance is made compared to that of other laboratories by using histograms.
This is additional to the Control Charts. The data for the histograms comes from the control chart.
A histogram is made of all data. A separate histogram is also made of your laboratory data. These two histograms are superimposed. It is calculated how much overlap the histogram has and what the correlation is for the total group.
This option is only available with an extended license.
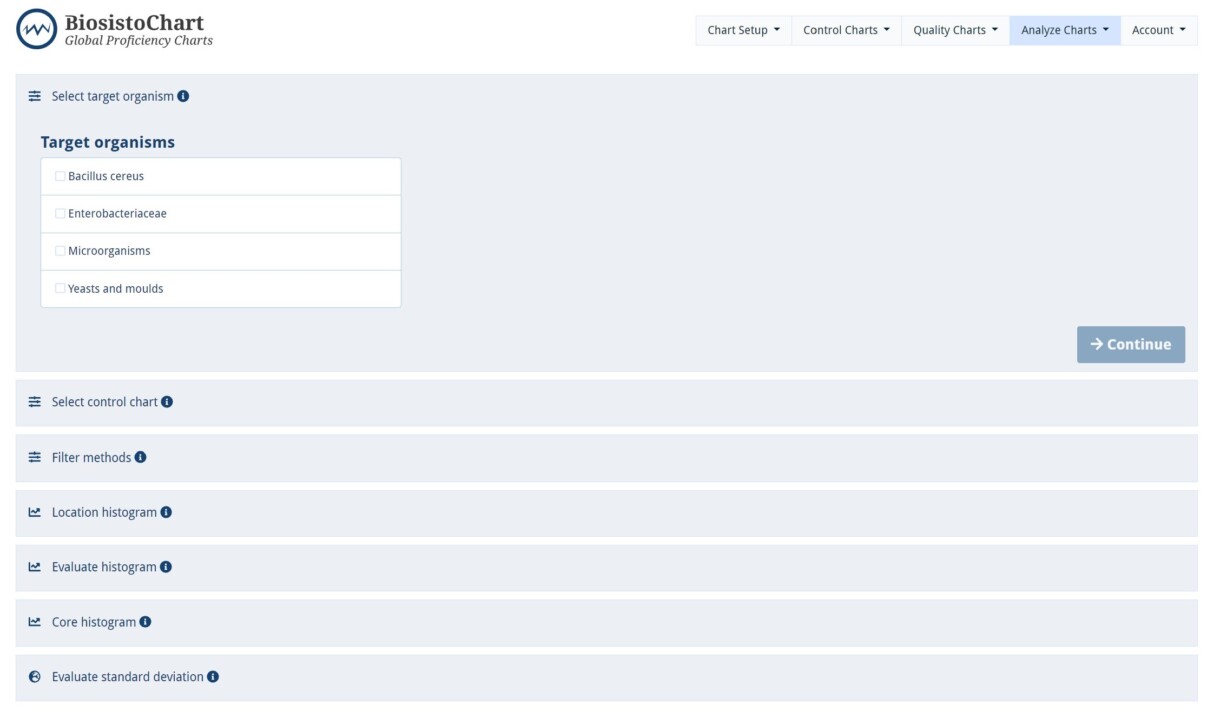
Selection of the different parameters
1. Select target organism
You select a target organism of the designated analyte for the proficiency test. You only see the target organisms of your Control Charts and the target organisms defined in your methods. If your target organism is not listed, adjust the appropriate method, or contact Biosisto.
2. Select Control Chart
Select one of the Control Charts to compare with other laboratories that use the same batch and strain of the Biosisto collection and envision the same target organism. The selection can be refined by clicking on accredited and/or closed charts methods
3. Filter methods
Based on your selected Control Chart, other laboratories’ methods are visible to compare. You can filter by the applied method, compliance with the standard, accreditation, heat treatment, and live stage of the organisms. These filters are based on the Control Chart selection and will not always be applicable.
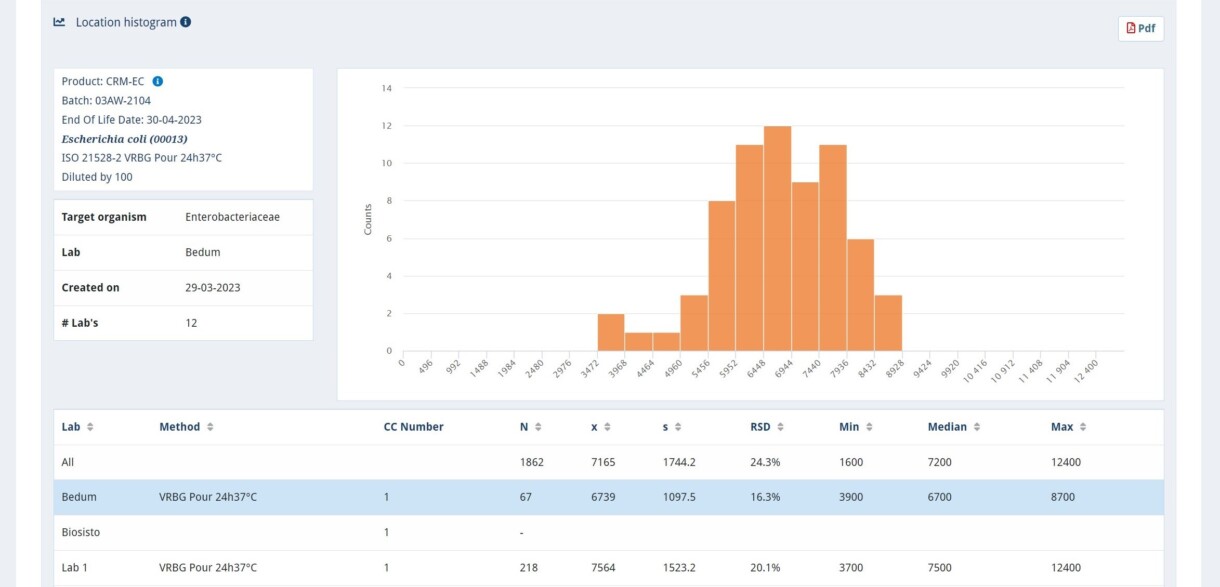
4. Location histogram (Example 1 below)
In de histogram, your own selected Control Chart results are presented. In general, there are 25 histogram classes defined. The smoother the gaussian distribution (a bell-shaped curve), the better the analysis results are normally distributed. The table gives a first impression of how your own results compare with other users.
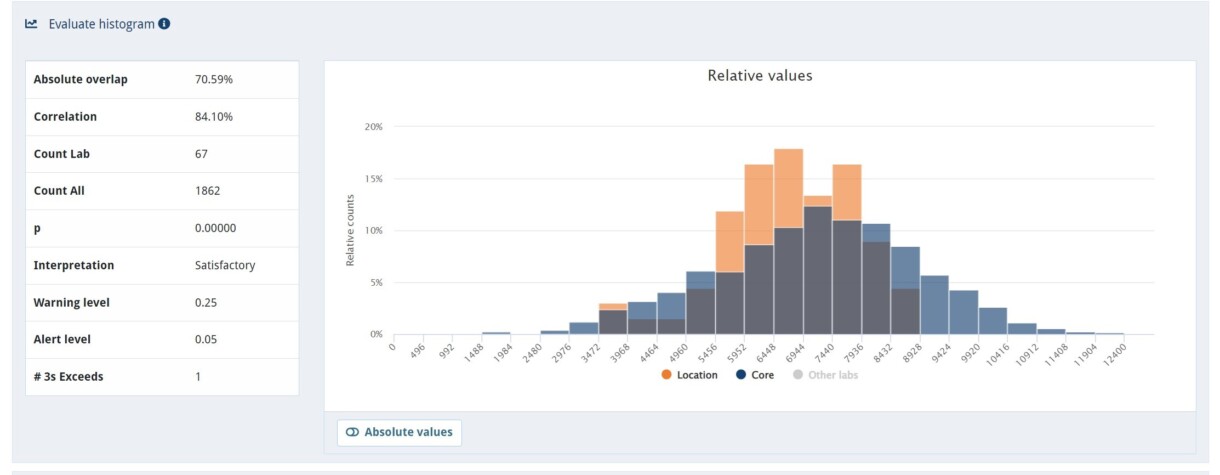
5. Evaluate histogram (Example 2 below)
In this panel, your own histogram is related to the histogram of all other laboratories. If the two curves are completely overlapping, there is little difference between the analysis. This is expressed as a percentage in the absolute overlap and correlation. It is also calculated whether there is a statistical difference. With a low p-value, the difference is limited and is interpreted as satisfactory. There are three options for interpretation:
Satisfactory: if p < alert level
Questionable: if p > alert level and < warning level
Unsatisfactory: if p > warning level
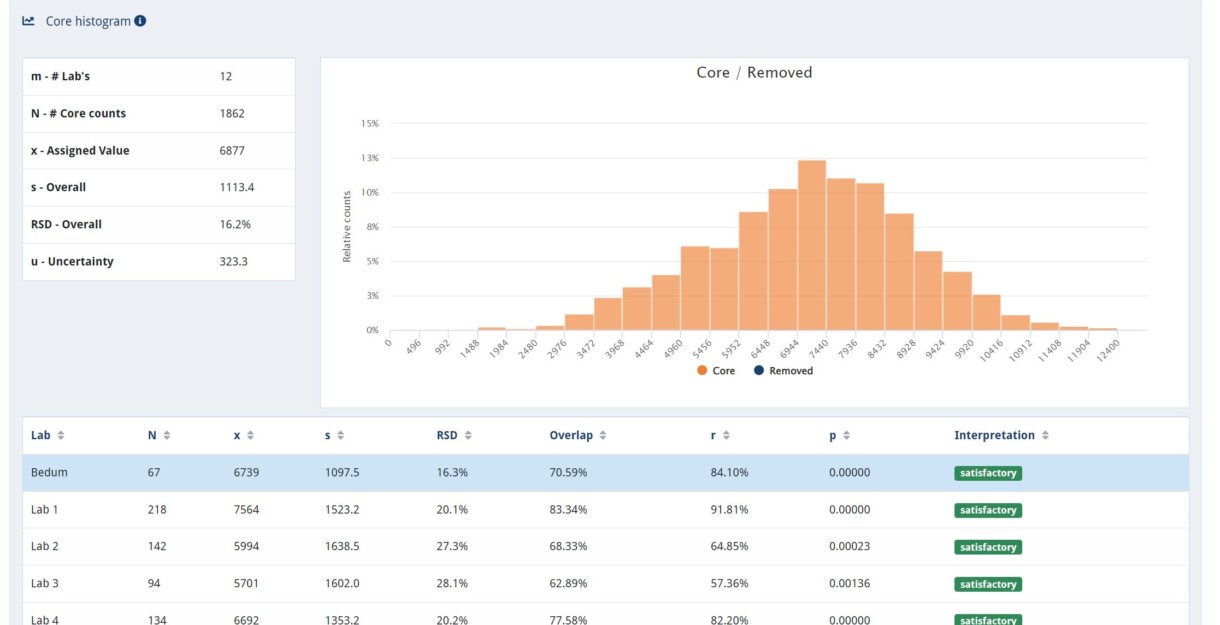
6. Core histogram (Example 3 below)
All laboratories are compared, and the laboratory with an unsatisfactory interpretation is removed. The removed group is visible in the histogram as ‘removed.’ All laboratories with satisfactory and questionable interpretations are used to calculate the assigned value and uncertainty. These labs together are visible in the histogram as Core. The table below the histogram shows the results of all laboratories.
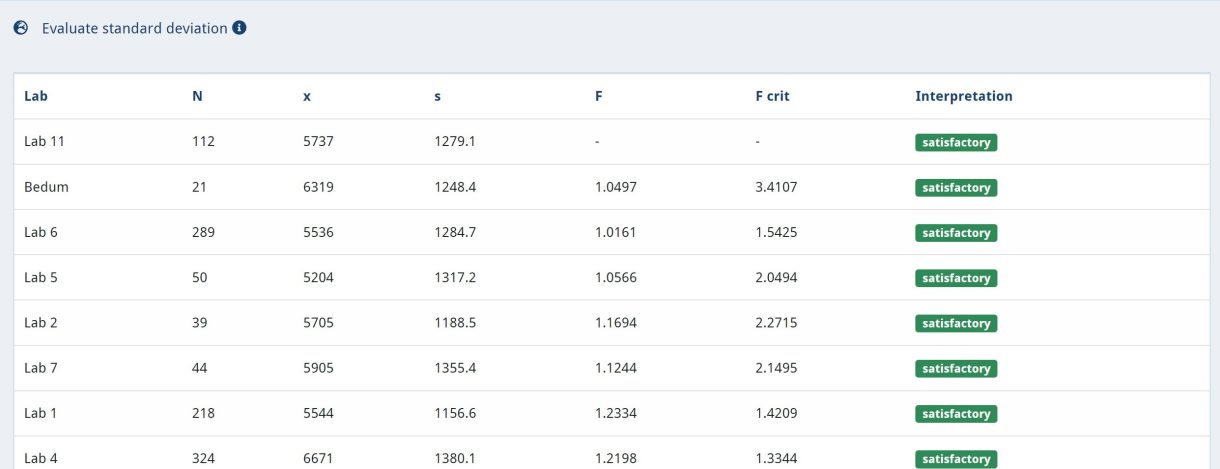
7. Evaluate standard deviation (Example 4 below)
Finally, the standard deviations are evaluated. The interpretation is not a test criterion in the context of the proficiency test. However, it indicates the standard deviation found by the laboratory in relation to all other laboratories.
The assessment depends, among other things, on the number of results per laboratory. If you have many results (degrees of freedom), the standard deviation will be tested more strictly. The F critical value will decrease as the degrees of freedom increase.