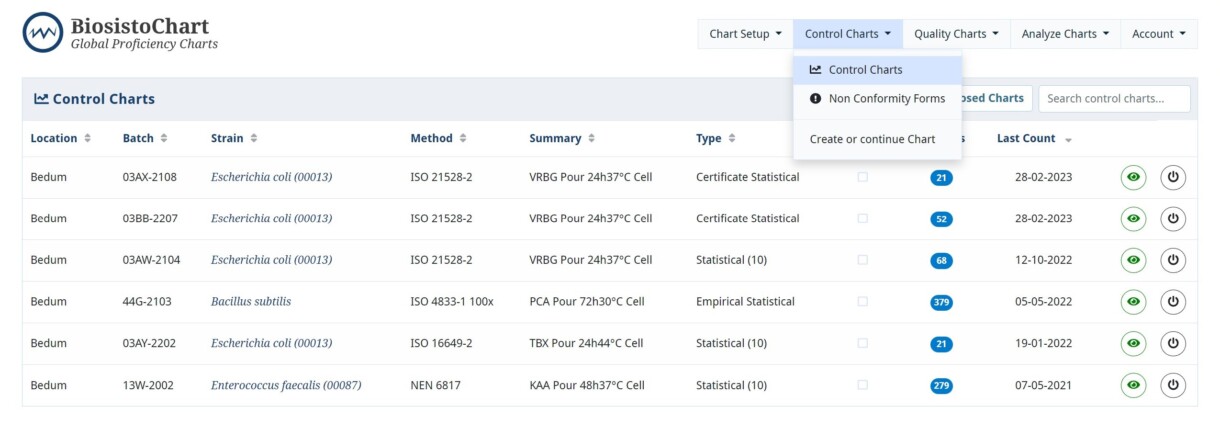
Control Charts
In this menu, Control Charts are created and analyzed.
Explanation different chart types
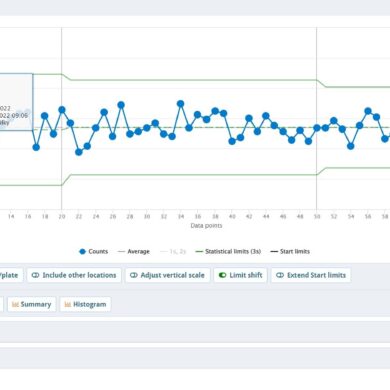
In the periodic review of the Statistical limits, the limits after the first 20 entered data points are calculated on every set of 30 data points. After each set of 30 data points, the calculated Statistical limits are evaluated statistically.
The Empirical chart types are only visible if the customer entered their Batch Limits for the selected Batch, Strain, and Method. The Certificate Chart types are visible if a method of Biosisto is selected.
In Statistical (10) and Statistical (20), the temporary Limits displayed during the entry of the first 10 or 20 counts are indicative and based upon the Certificate or Empirical values.
You can set the most used Chart type on default in the Customer setting.
| Type Chart | Description |
|---|---|
| Certificate Fixed | The limits are determined on the basis of the values on the Certificate of Analysis and remain fixed throughout the Control Chart |
| Certificate Statistical | The limits are determined on the basis of the values on the Certificate of Analysis, and the limits are recalculated and checked periodically according to NEN 6603 |
| Empirical Fixed | The limits are determined on the basis of the entered Average and Standard Deviation by the customer and remain fixed throughout the Control Chart |
| Empirical Statistical | The limits are determined on the basis of the entered Average and Standard Deviation by the customer and periodically recalculated and checked periodically according to NEN 6603 |
| Statistical (10) | There are no limits, and after 10 entered data points temporarily, Statistical limits are calculated based on the 10 entered counts. To this point, Non Conformity Form can occur. After 20 entered counts, new Statistical limits are calculated and set based on the 20 entered Datapoints. After the 20 datapoints, one datapoint can be designated as an outlier. Then the limits are periodically (re)calculated and tested according to NEN 6603 |
| Statistical (20) | There are no limits, and after 20 entered datapoints, Statistical limits are calculated based on the 20 entered counts. To this point, Non Conformity Form can occur. After 20 entered datapoint, one datapoint can be designated as an Outlier. Then the limits are periodically (re) calculated and tested. |