Batch limits
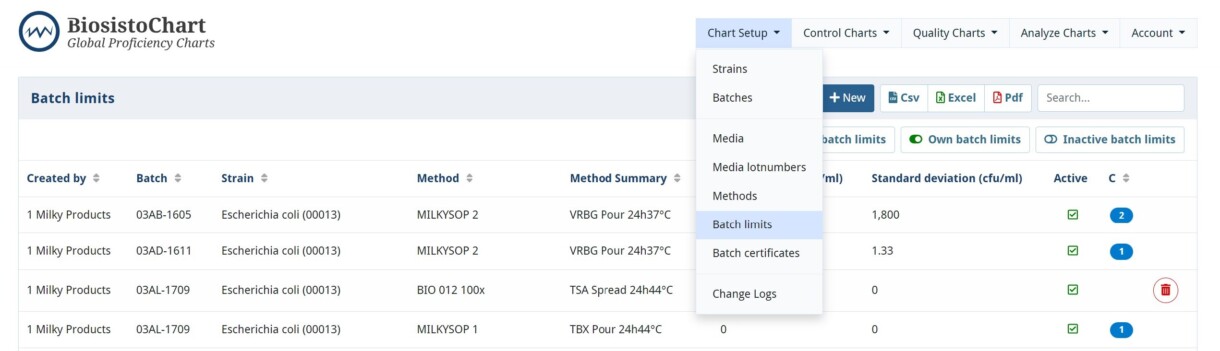
On the Batch limits page, you see an overview of all the batches used at your laboratory. Inactive batch limits and not-own batch limits are not displayed by default. A selection can be made with the selection option at the top of this page.
A Batch limit must be entered for each new batch for every method used with the batch.
Viewing and edit batch limit
Select a batch, and you will see the Batch limit in detail.
With starting limits
Fill in the batch property value and standard deviation set on the Certificate of Analysis.
These are then the chart’s starting limits.
The y-axis will be filled in automatically.
Without starting limits
You can choose not to fill in the property value and standard deviation. Then, enter 0 for the mean and SD.
The chart will start up without limits.
You do need to define y-axis.
Batch limits, once entered, cannot be adjusted!

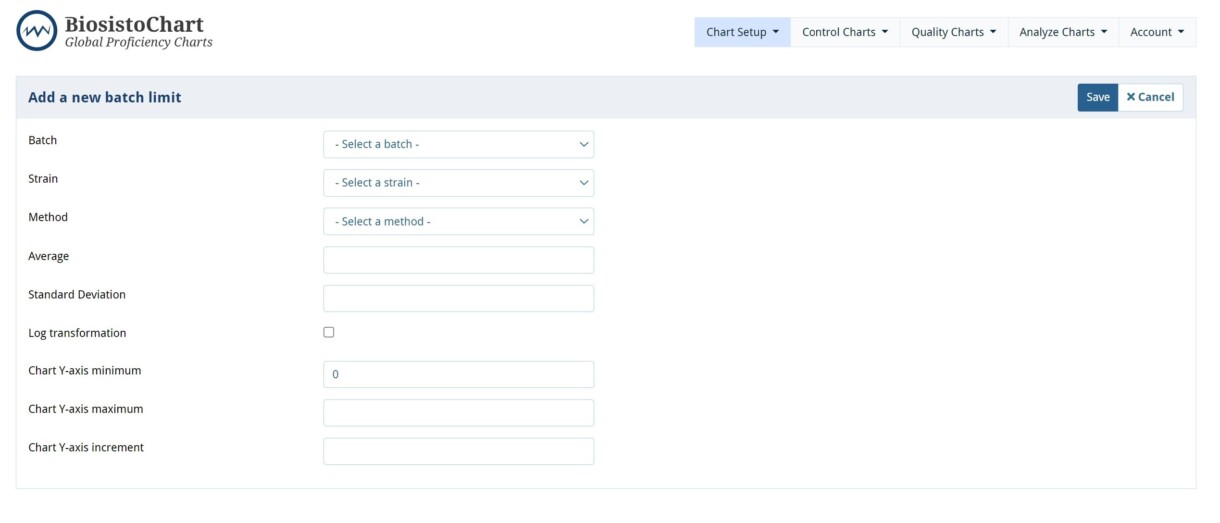
Creating New batch limits
- Select from the dropdown menu the Batch, Strain, and Method
- Fill in the Property value and the Standard Deviation from the Certificate of Analysis
- The Charts Y-axis has been filled in automatically.
| Item | Kind of information |
|---|---|
| Created by | Company name |
| Batch | Batch number |
| Strain | Name of the strain or total count in case of a multi-strain |
| Method | Analyse Method |
| Method Summary | Information about uses of media and incubation circumstances |
| Property value (cfu/ml) | The concentration per cfu/ml |
| Standard deviation (cfu/ml) | The standard deviation per cfu/ml |
| Active | If the box is ticked, then the Chart is active |
| C | Total of Charts that are active |
| Uncertainty | The Uc, expanded standard uncertainty, is based upon at least one batch of the same product with two years of storage |
| Log transformation | Tick the box if you want to display your controlchart in log |
| Chart Y-axis minimum | The minimum value of the Y-axis. It is filled in automatically after the Property value, Standard deviation, and, if available, the Uncertainty is filled in |
| Chart Y-axis maximum | The maximum value of the Y-axis. It is filled in automatically after the Property value, Standard deviation, and, if available, the Uncertainty is filled in |
| Chart Y-axis increment | The increment of the Y-axis. It is filled in automatically after the Property value, Standard deviation, and, if available, the Uncertainty is filled in |
| Biosisto Only | Only used by Biosisto |