Quality Charts
You can see an overview of all active Quality Charts on the Quality Chart Menu.
Closed Charts is not displayed by default. A selection can be made with the selection option.
A Quality Chart can be closed if not in use anymore.

Viewing and adding a data point to an existing Quality Chart


Information you can see on the Quality Chart screen
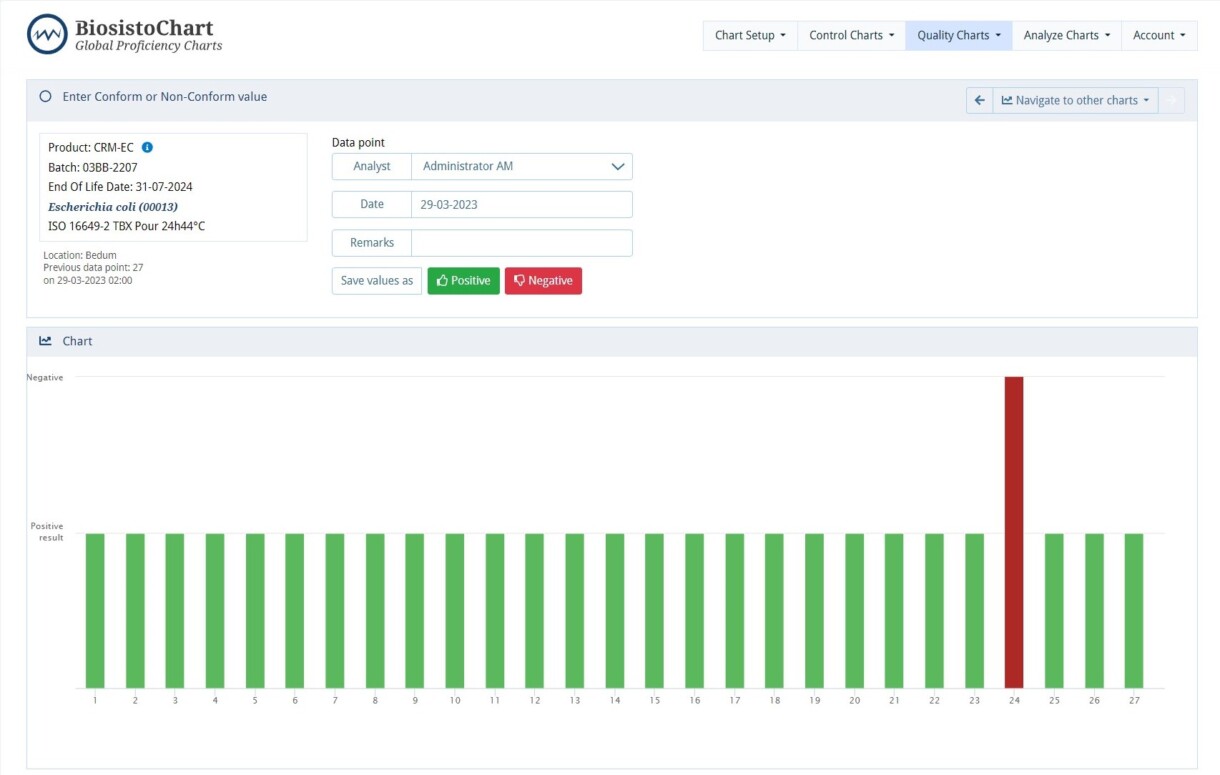
The screen to enter data points is divided into different components.
- The panel in the upper left corner provides information about the method and its properties.
Directly below is information about the type of ControlChart, location, number of data points, and the date of the previous data point. - In the panel Batch count, you can fill in the result of the CRM.
- Graphical representation of the Quality Chart. Green lines are the Okay results. The red lines are the Not Okay results.
If the result is Not-Okay, an NCF will be automaticaly generated, and a follow-up must be initiated. - The panel Data Points can be unfolded
This panel lists all imported data points in chronological order of the entry date. Data points can be edited or deleted.
| Item | Kind of information |
|---|---|
| Location | Your laboratory location |
| Batch | This is the batch number of a product. For a Biosisto product, this is the batch number. For own batches, this can be a self-chosen batch number |
| Strain | Strain the is used in the product |
| Method | The method in the quality chart |
| Summary | Summary of the media and incubation conditions |
| Closed | If the box is ticked, the ControlChart is closed. Adding data points is no longer possible, but the Control Chart remains in the system for analysis and reporting capabilities. |
| Data Points | The total number of data points is the quality chart |
| Last Count | he data from the last countThe last symbol means: Close this chart. Adding data points is no longer possible, but the ControlChart remains in the system for analysis and reporting capabilities. It is possible to re-open a closed chart. |


