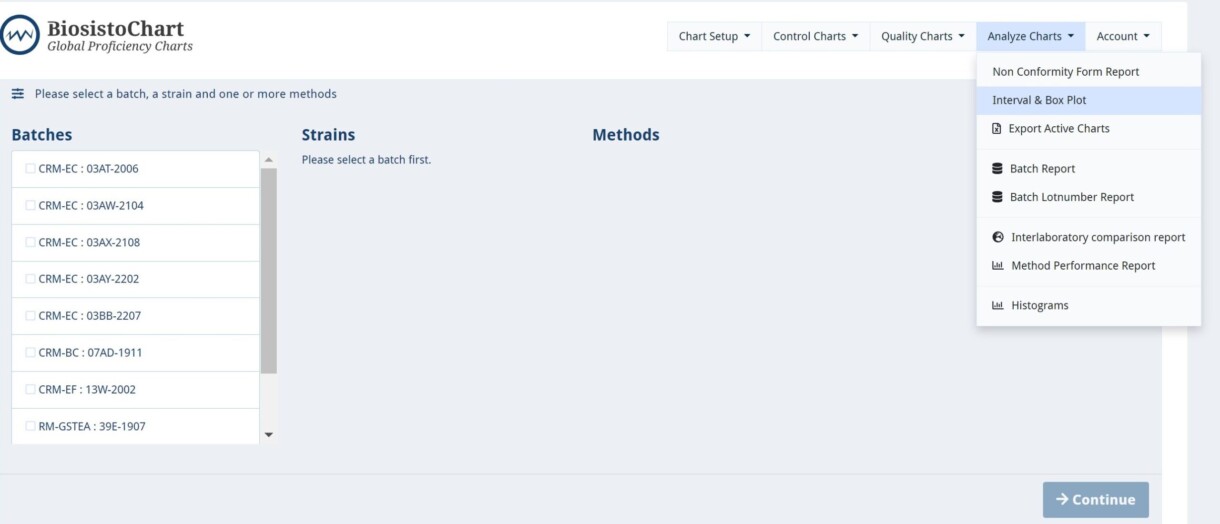
Interval & Box plot
This menu shows a Control Chart of all the customers in an Interval & Box plot graphic.
This option is only available with an extended license.
It is possible to select more than one method, which makes it possible to compare different methods.
A box plot is a graph that indicates the spread of the values in a data set. Box plots are a standardized way of representing the distribution of data based on five important numbers: a minimum boundary, the first quartile (Q1), the median (or second quartile Q2), the third quartile (Q3), and a maximum boundary.
Interval & Box plot diplay
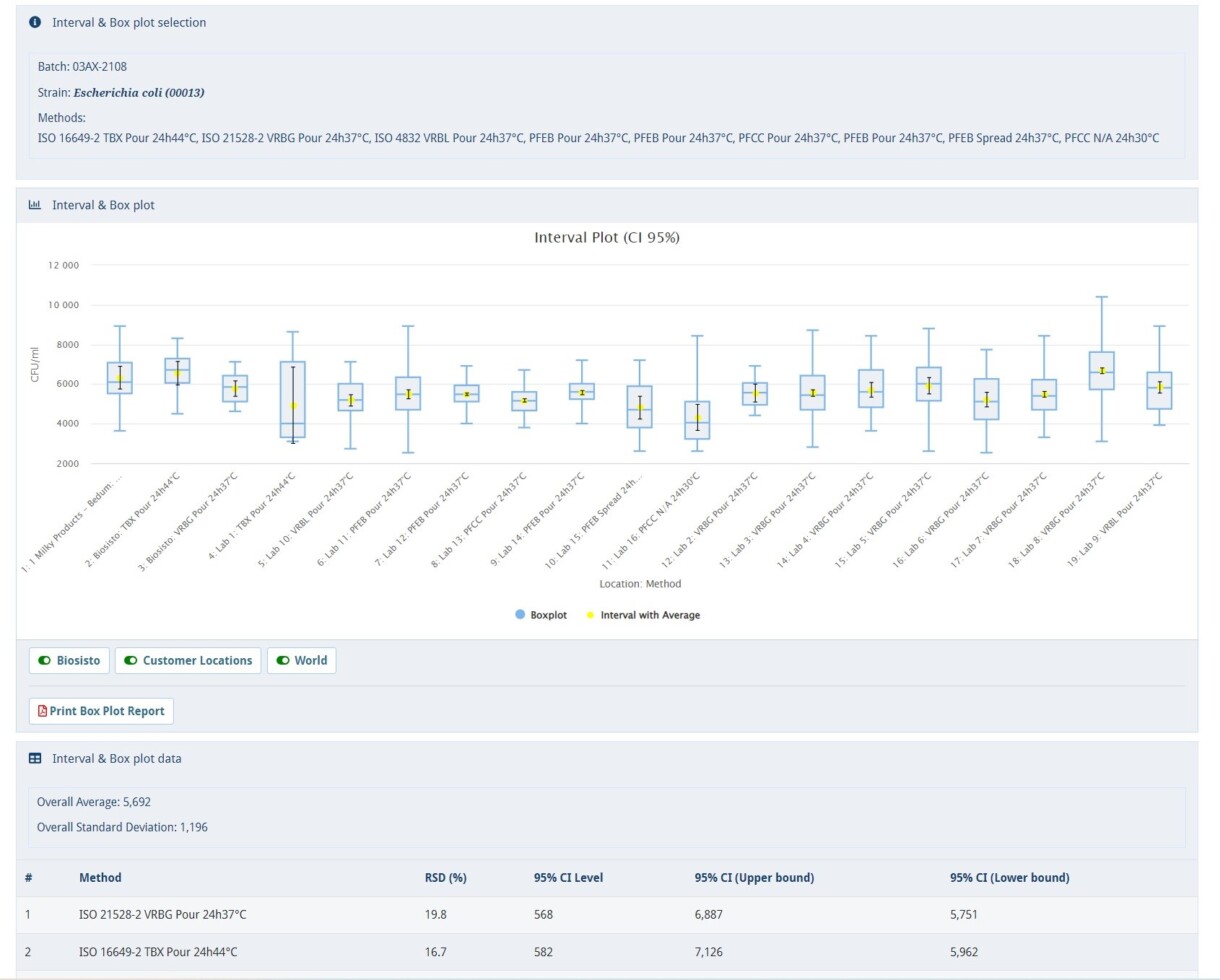
Item on the Interval & Box plot display
A mouse hover appears with all relevant information if the mouse pointer is held above a box plot or Interval Plot.
In the chart settings panel, the graphic display of the Box plot can be changed; selections take place directly in the graph.
- Biosisto – Display the Biosisto Charts for the selected Batch, Strain, and Method(s)
- Customer Locations – Display the plots of Company locations (only visible with a Company license)
- World – Display the plots of all locations (only visible with a World license)
The following figures are displayed in the Interval & Box plot chart:
Interval plot
- Average
- 95% CI* Lower bound
- 95% CI* Upper bound
There is no statistical difference between the groups if the intervals overlap.
CI* = Confidence interval
Box plot
- Box stripe is Median
- Box high is 1st quartile
- Box low is 3rd quartile
- The line through Box shows the minimum and maximum counts
You will find relevant information on each method in the lowest panel. Such as used Methods, RSD, and CI’s.