Interlaboratory Comparison Report
In this chapter, it is possible to create an Interlaboratory Comparison Report.
An Interlaboratory Comparison (Proficiency) report can be created for each batch or method in the selected period.
A statistical comparison is made per batch, strain, and method of all customer data, including a Z-score and related relevant data.
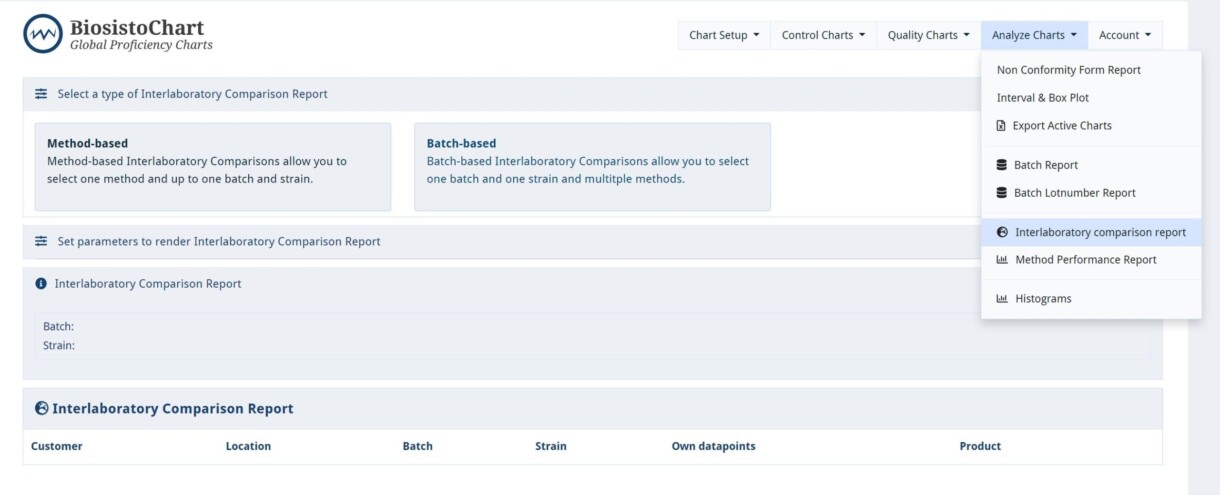
Select a type of Interlaboratory comparison Report you want to make: Method or Batch-based Comparison.
A list of the selected method, batches, and strains is displayed. The Report can be viewed by pressing Open Panel.
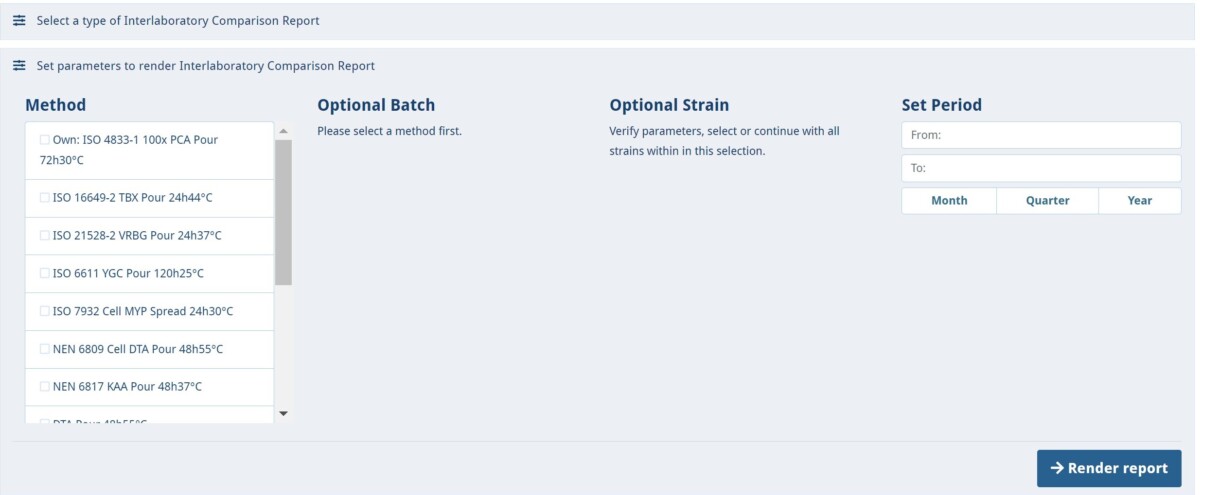
Method-based Interlaboratory Comparison
Method-based Interlaboratory Comparisons allow you to select one method and up to one batch and strain.
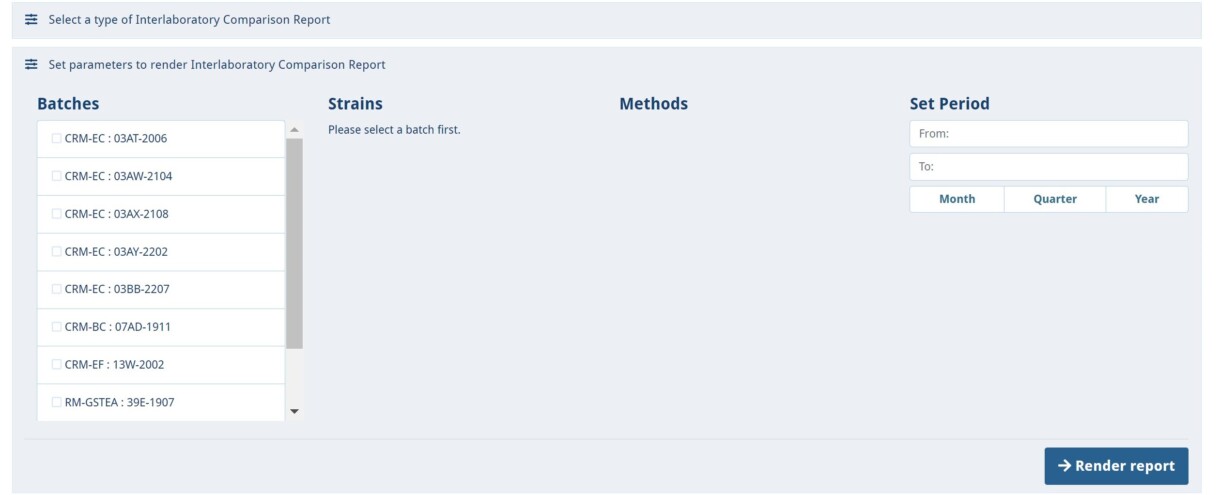
Batch-based Interlaboratory Comparison
Batch-based Interlaboratory Comparison allows you to select one batch and one strain, and multiple methods.
| Item | Kind of Report information |
|---|---|
| Performance | RobustMean, Robust Standard, Deviation, Relative Standard, Deviation, Reproducibility, Total Iterations |
| Laboratory Z-scores | Laboratory, Average, Data Points, RSD, Z-score, Interpretation (satisfactory - questionable - unsatisfactory) |
| RSD chart | A chart with RSD of all the laboratories |
| Z-scores | A chart with Z-scores of all the laboratories |