Control Charts
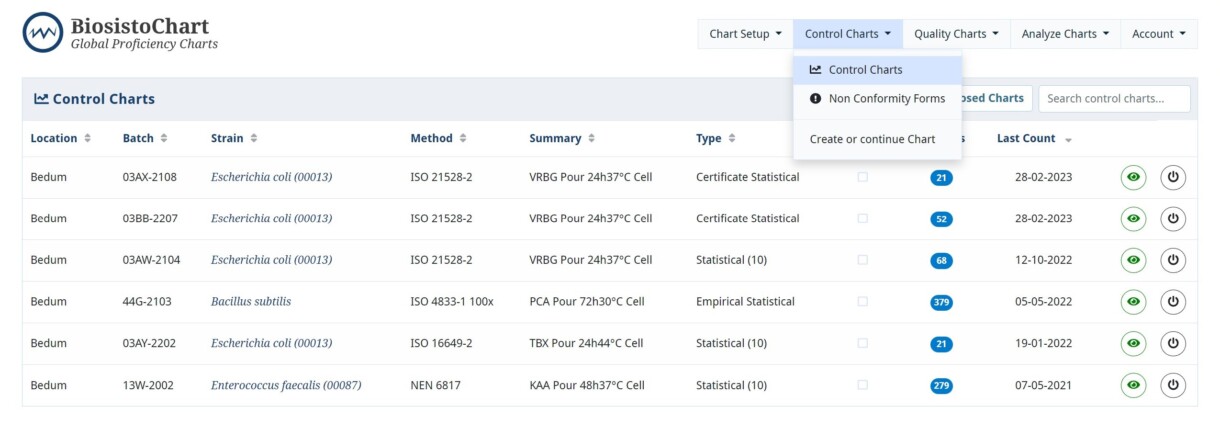
You can see an overview of all the Control Charts active at your laboratory on the Control Chart menu.
Include Closed Charts is not displayed by default. A selection can be made with the selection option.
Options in this menu:
- Close the Control Chart – when the Chart is not in use anymore but participates in statistical comparison studies.
- Hide the Control Chart – When the Chart is only meant for your laboratory. NB the Chart is excluded in statistical studies.
| Item | Kind of Information |
|---|---|
| Location | Your laboratory location |
| Batch | This is the batch number of a product. For a Biosisto product, this is the batch number. For own batches, this can be a self-chosen batch number |
| Strain | Strain the is used in the product |
| Method | The method in the control chart |
| Summary | Summary of the media and incubation conditions |
| Type | Type of control Chart |
| Closed | If the box is ticked, the ControlChart is closed. Adding data points is no longer possible, but the Control Chart remains in the system for analysis and reporting capabilities. |
| Data points | The total number of data points is the control chart |
| Last Count | The data from the last countThe last 2 symbols mean: (see also further down this chapter Close a ControlChart)Hide this chart. All ControlCards are visible in the various reports and analysis capabilities by default. A ControlChart that is not visible remains in the system but not in the ControlCharts menu. Close this chart, It is no longer possible to add data points, but the ControlChart remains in the system for analysis and reporting capabilities. It is possible to re-open a closed chart. |
Viewing and adding a data point to an existing Control Chart - whole screen
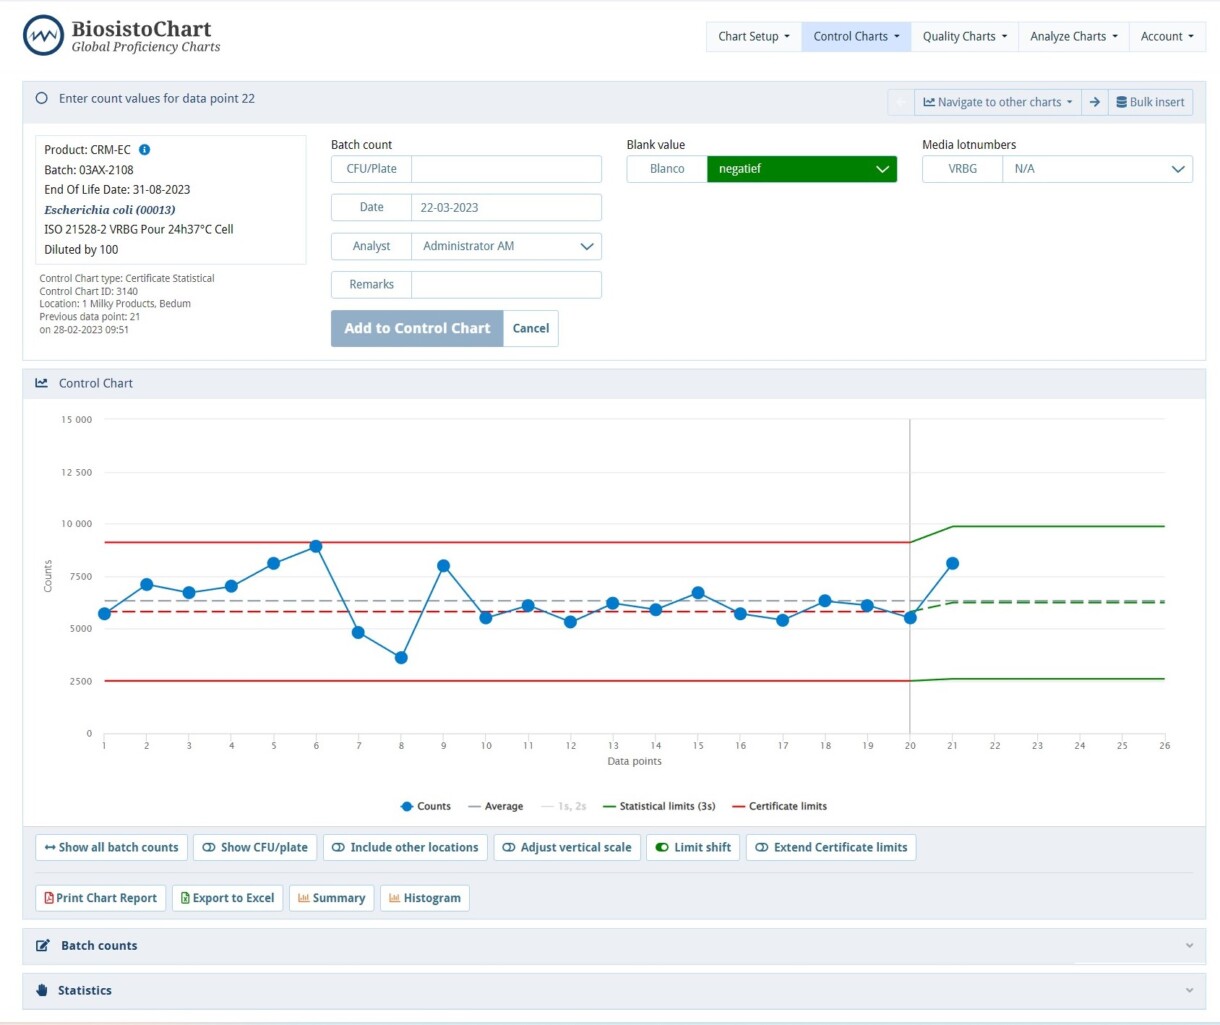
Top of the screen - Adding data point
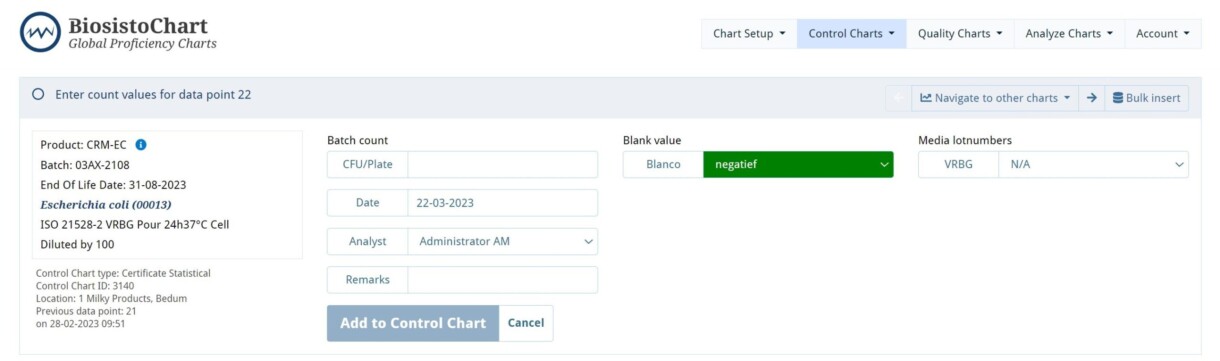
The screen to enter data points is divided into different components.
You will find information about the method and the control chart specifications on the left side.
Batch count, Fill in the number of counted colonies on the plate if the dilution is incorporated into the method.
Date, The date the analysis was performed (default is the current date)
Analyst, The analyst who performed the analysis (default is the signed-in analyst). It is possible to select another analyst with an account through the drop-down menu
Remark, Room for comments
Blank value, Fill in the result of the Blank via a drop-down menu (only available for laboratories with an extended basic license)
Media lotnumbers, Select the lot number via a drop-down menu (only available for laboratories with an extended basic license)
Navigate to other charts, Through the drop-down menu. You can easily go to another controlchart
Bottom of the screen - Information and settings
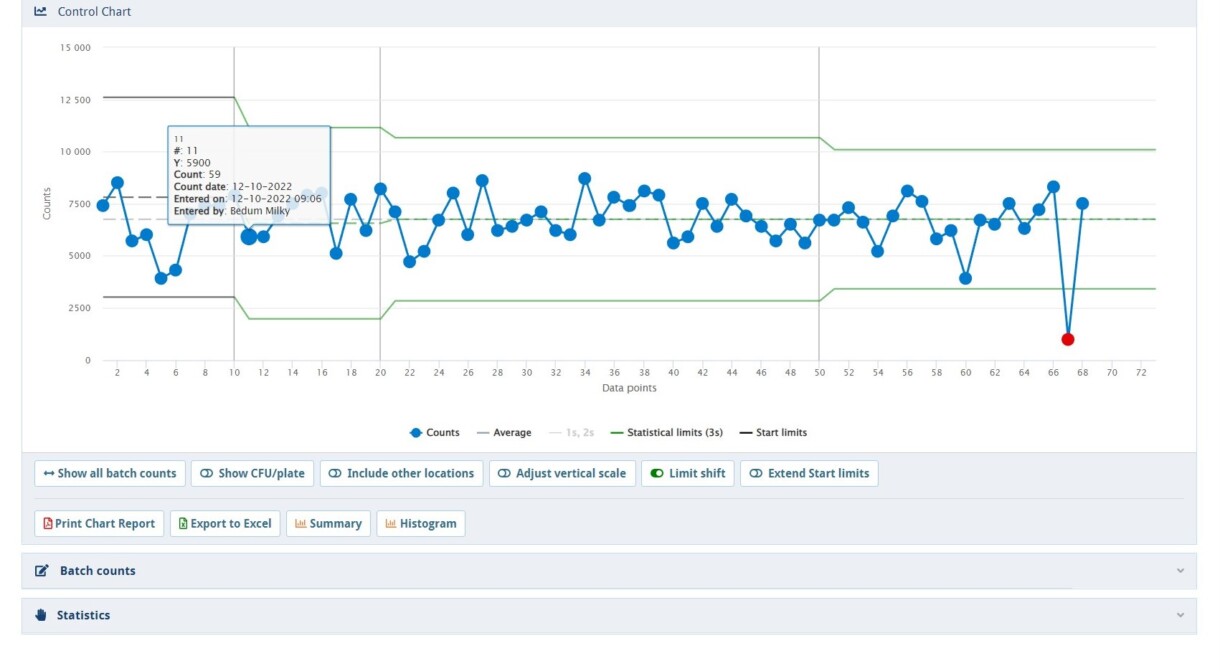
Information about the bottom of the screen
The bottom screen to enter data points is divided into different components.
Graphical representation of the ControlChart, with the warning levels (red), set average (red), an average of the entered data points (grey), and separate data points (blue). Recalculated warning levels are green. When the mouse hovers over a blue data point, you will see more information about that entered data point. See further explanation in the table below.
Chart settings panel, the graphic display of the Control Chart can be changed; selections take place directly in the graph. The buttons can be turned on and off.
Batch count, The Batch counts bar can be unfolded. This panel lists all imported data points in chronological order of the entry date. Counts can be edited or deleted. Batch Counts which not yet participate in the calculation of a statistical Limit can be changed or deleted by the user. Modifying a Batch Count does not affect any existing NC Forms. When the old Batch Count was not conform and the new value conforms, the user must manually close the appropriate NC Form. If the new value does not conform to the limits, then a new NC Form is created. When a Batch Count is deleted, all related data is also removed. So new Statistical limits, Outliers, NC forms can automatically be removed when a Datapoint is deleted.
Statistics, The panel Statistics can be unfolded. In this panel, all the statistical data is shown as, Active form count, the average, StDev, RSD, UCL, and LCL per chart per 30 data points after the start chart of 10 or 20 data points. NC in the transition to the new chart is also visible.
| Item | Kind of information |
|---|---|
| Show all batch counts | Reset the zoom to show all batch counts at once. Zooming in can be done by dragging inside the chart |
| Show CFU/plate | Show CFU counted on the plate |
| Include Other location | Include charts from other locations with a similar batch, strain, and method. This is only available if you have a Company license |
| Adjust vertical scale | Automatically adjust the vertical scale instead of using the predefined vertical scale |
| Limit shift | Show markers where a new batch limit starts |
| Extend Start limits | Extend the start, certificate, or empirical limits until the end of the chart |
| Print Chart Report | Print a PDF document of the range in the ControlChart |
| Export to Excel | Export all the data to excel |
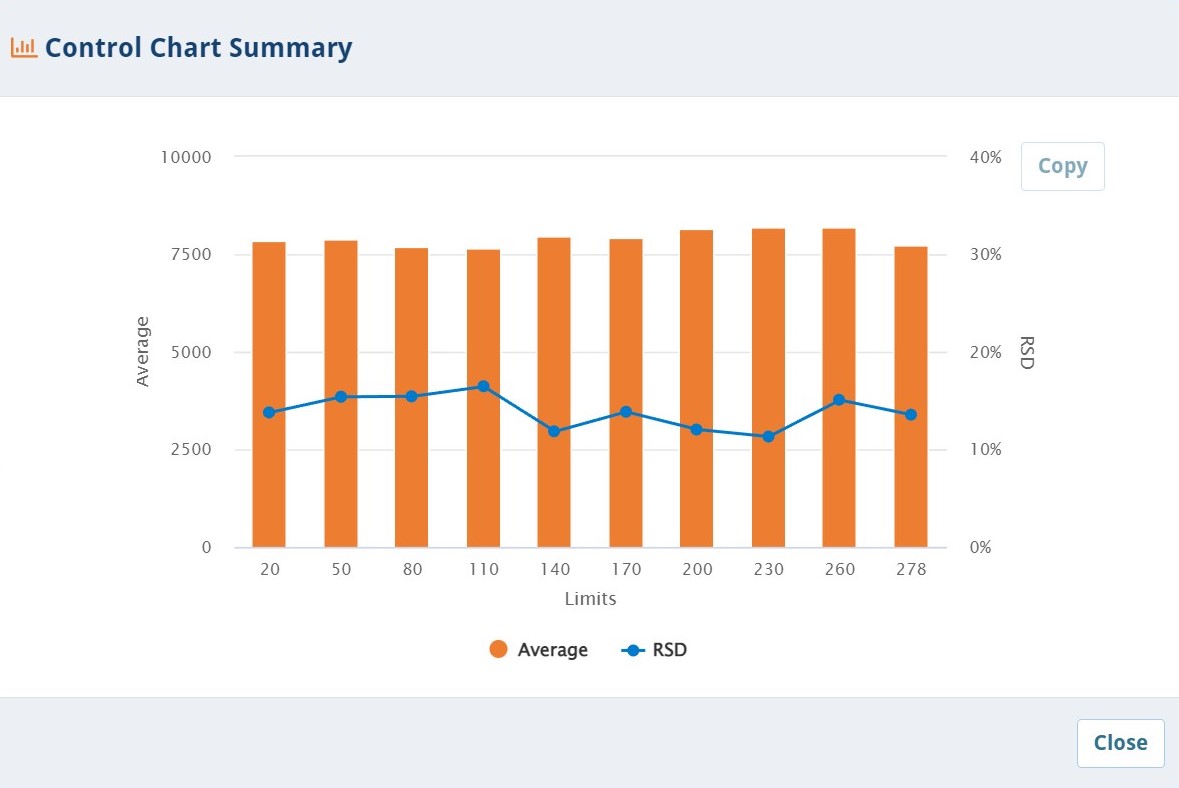
| Summary | Display a summary of the ControChart (average and SD per Chart of 30 points). See figure below |
| Histogram | Displays a histogram of all the datapoints. See figure below |